| 纽约都会区 New York–Northern New Jersey, NY, NJ, PA | |
|---|---|
 | |
| 国家 | |
| 州份 | |
| 最大城市 | 纽约 |
| 其他城市 | 纽瓦克 泽西市 扬克斯 帕特森 布里奇波特 伊丽莎白 斯坦福 纽黑文 沃特伯里 诺沃克 丹伯里 新罗谢尔 爱迪生、特伦顿 |
| 面积 | |
| • 总计 | 11,842 平方英里(30,000 平方公里) |
| 人口(2010年美国人口普查) | |
| • 密度 | 1,865人/平方英里(720人/平方公里) |
| 时区 | EST(UTC-5) |
| • 夏时制 | EDT(UTC-4) |
| 电话区号 | 212, 646, 917, 718, 347, 860, 929, 516, 631, 914, 845, 570, 203, 201, 551, 862, 973, 908, 609, 732, 518 |
| 最高点 4,180 ft/1,274 m(卡兹奇山斯莱德山 (Ulster County, New York)) 最低点 0 ft/0 m(海平面):大西洋、长岛海湾及哈德逊河河口湾水道 | |

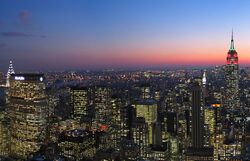
纽约都会区,也被称为三州地区,是全美国最大的都会区,也是全世界最大都会区之一,位于美国东北部。
整个都会区以纽约市为中心,包括纽约州上州的六个郡与长岛的两个郡,新泽西州的十四个郡,康涅狄格州的三个郡,以及宾夕法尼亚州东北部的一个郡所组成。全部地区由城区与郊区所组成。
根据2015年美国人口调查局的估计,纽约都会区仍然以相当大的差距位居美国人口最多的地区,不管是定义的大都会统计区(2020万人口)[1]还是联合统计区(2370万人口);[2]它也是世界上人口最多的城市群之一,以及北美洲最大的城市群。[3][4][5]纽约都会区继续成为向美国合法移民的首要门户,[6][7][8][9]拥有世界上任何大都会地区最多的外国出生人口。 都会统计区覆盖17,405平方公里,联合统计区面积34,493平方公里,涵盖种族和地理上不同的地区。 纽约都会区的人口比纽约州的人口多,而且到2016年,大都会区领空的乘客人数已达1.3亿。[10]
作为许多行业的中心,包括金融、国际贸易、新型传统媒体、房地产、教育、时尚、娱乐、旅游、生物技术和制造业,纽约市都会区是世界最重要的经济区域之一;在2015年,都会统计区[11]产生了将近1.6兆美元的生产总值(GMP)[12],而在2015年,联合统计区的GMP超过了1.83兆美元,均位居全国第一,两者分别仅次于9个国家和7个国家的GDP。[13]
参考资料
- ↑ Annual Estimates of the Resident Population: April 1, 2010 to July 1, 2015 – Metropolitan Statistical Area; and for Puerto Rico – 2015 Population Estimates. U.S. Census Bureau. [2016-03-28].
- ↑ Annual Estimates of the Resident Population: April 1, 2010 to July 1, 2015 – Combined Statistical Area; and for Puerto Rico – 2015 Population Estimates. U.S. Census Bureau. [2016-03-28].
- ↑ World's Largest Urban Areas [Ranked by Urban Area Population]. Rhett Butler. 2003–2006 [2011-11-25].
- ↑ Largest Cities of the World – (by metro population). Woolwine-Moen Group d/b/a Graphic Maps. [2011-11-25].
- ↑ Largest urban areas in the world: 2008 All Urban Areas 2,000,000 & Over (PDF). Wendell Cox Consultancy. [2011-11-25].
- ↑ Yearbook of Immigration Statistics: 2013 Lawful Permanent Residents Supplemental Table 2. U.S. Department of Homeland Security. [2014-07-31].
- ↑ Yearbook of Immigration Statistics: 2012 Supplemental Table 2. U.S. Department of Homeland Security. [2014-07-31].
- ↑ Yearbook of Immigration Statistics: 2011 Supplemental Table 2. U.S. Department of Homeland Security. [2014-07-31].
- ↑ Yearbook of Immigration Statistics: 2010 Supplemental Table 2. U.S. Department of Homeland Security. [2014-07-31].
- ↑ The Port Authority of NY and NJ 2016 Air Traffic Report (PDF). The Port Authority of New York and New Jersey. 2017-04-14 [2017-06-26].
- ↑ Revised Delineations of Metropolitan Statistical Areas, Micropolitan Statistical Areas, and Combined Statistical Areas, and Guidance on Uses of the Delineations of These Areas – page 106 (PDF). Executive Office of the President Office of Management and Budget. [2014-06-27].
- ↑ Gross Metropolitan Product (GMP) of the United States in 2013, by metropolitan area (in billion current U.S. dollars). Statista. [2014-09-12].
- ↑ U.S. Metro Economies (note CSA 2012 GMP total includes sum of New York, Bridgeport, New Haven, Scranton, Trenton, Poughkeepsie, and Kingston MSA 2012 GMP values cited) (PDF). IHS Global Insight, The United States Conference of Mayors, and The Council on Metro Economies and the New American City: 9 through 18 in Appendix Tables. November 2013 [2014-06-27].